
· Guide · 4 min read


MTR (my traceroute) is a dynamic network performance diagnostic tool combining the functionality of ping and traceroute. It investigates the connection between destination host and source server (eg. your DataPacket server). Precisely described, it analyses the response time and packet loss of routers (hops) passed on the way to destination and back through TTL (time to live) using ICMP. MTR sends a stream of packets while successively increasing TTLs where each packet is discarded by the successive hop (first hop has TTL one, second hop has TTL two, etc.), so we can see the trace to a given host.
MTR is an interactive tool, constantly updating its output. Whenever our customer spots a connectivity issue, we ask for an MTR report. An MTR report doesn’t generate continuous sending of ICMP packets but gives you a greater range of data, sending 10 packets to each hop by default. Mtr reports are widely used for analysing network connection bottlenecks and issues. However, it is very commonly misinterpreted.
MTR comes pre-installed on just about every Linux distribution. In the opposite case, run the following commands:
apt update && apt upgrade
apt install mtr-tinyyum update
yum install mtrFor Windows, there is an application called WinMTR and for MAC, install the homebrew package manager to run MTR.
SSH into your server to generate a report examining the path from your server to your home ISP. Add your home IP address to the command.
mtr [YOUR HOST IP] -rFor MTR report generation, use
-r option flag. If you’d like the results to be more reliable, increase the cycle counts
-c(10 cycles by default) and decrease the interval
-i(1 second by default).
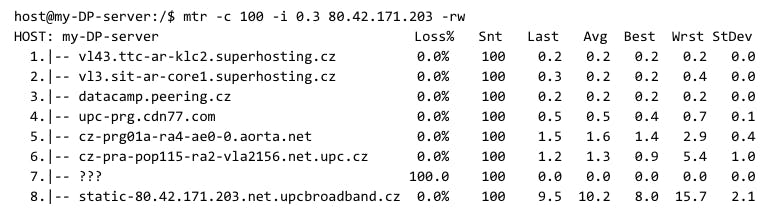
Use parameter report wide
-wflag that doesn’t truncate long DNS.
Force the
-nflag which displays IP addresses as a numeric record instead of reverse DNS lookups.
All MTR examples in this article are hypothetical, not based on real network data.
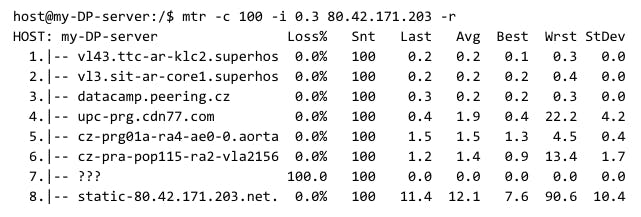
Each number in the report represents one hop – usually a router passed on the path from source to destination.
Loss%– what percentage of packets will not return
Snt– count of sent packets
Last– latency of the last sent packet
Avg, Best, Wrst– average, best and worst latencies of all packets
StDev– the standard deviation of latencies to each hop. A high StDev means there are network inconsistencies
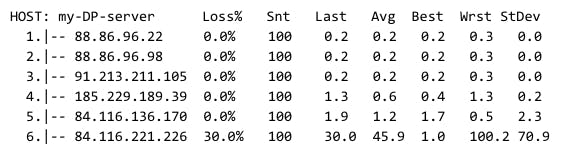
A packet loss at one hop on the path doesn’t mean there is something wrong with routing, neither does it mean that the path is congested. When you see an output showing a loss, it’s usually due to ICMP limits set on the router, eg. ICMP rate limiting.
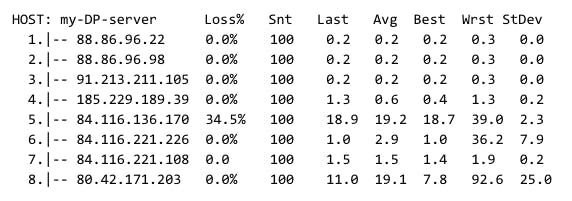
The loss in our example is caused by ICMP rate limiting which is a common practice used not to overload router CPU by ICMP requests. If there is an actual issue, the loss would most likely continue on subsequent hops following the hop with increased (compared to the previous hop) loss.
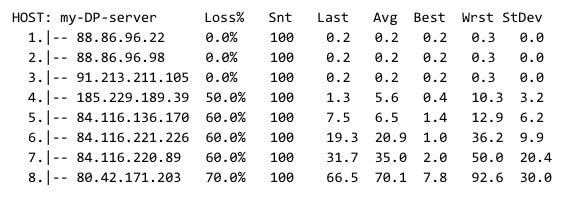
In this example, you are most likely losing some traffic because there is significant packet loss which is higher for subsequent hops following hop 4.
Packet loss on the last hop is likely a last mile issue on the side of the end user’s ISP, not an issue with the connection between your server and the ISP.
If question marks appear in your MTR output, it indicates that the host we are trying to reach doesn’t have ICMP echo reply enabled.
If your report shows question marks but no packet loss, there is no network connection problem. Question marks and packet loss are caused by a router discarding ICMP.
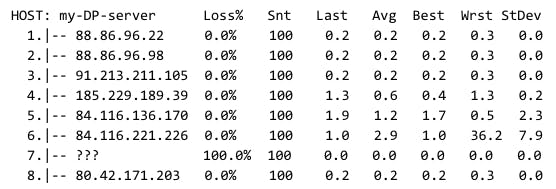
An issue might occur when the packets never reach their destination. This might be caused by disabling ICMP echo request on routers on the path.
Note that most issues displayed in your MTR report are temporary and will be corrected soon after they occur. DataPacket’s support and network administrators monitor our immense network 24/7 with help of an in-house built monitoring software. If you spot any network-related issue, create a support ticket in your client panel and we will get in touch.
Founded in 2014, DataPacket is a dedicated server provider operating a global low-latency network. With a footprint of 67 locations across 6 continents, DataPacket helps businesses–including gaming and video streaming companies–to deliver great online experiences.